Are Your Greenhouse Lights Delivering the Results You Expected?
A mid-season lighting assessment allows growers to verify that their horticultural lighting system is delivering the intended light levels, operating efficiently, and supporting crop goals. It can also uncover issues that reduce crop uniformity, increase energy costs, and limit yield potential long before they become expensive problems.
Whether you operate a traditional HPS installation, a modern LED system, or a hybrid lighting strategy, benchmarking lighting performance provides the data needed to optimize results and maximize return on investment.

Why Mid-Season Benchmarking Matters
Environmental conditions change throughout the growing season. Fixture performance, crop canopy development, greenhouse cleanliness, and operational practices can all affect the amount of usable light reaching plants.
Without periodic measurement, growers may unknowingly experience:
- Reduced light output from aging fixtures
- Dirt accumulation on fixtures, light sensors and greenhouse glazing
- Uneven light distribution caused by unidentified fixture failures
- Changes in canopy density affecting light penetration
- Increased energy consumption without corresponding crop benefits
- Lower crop uniformity and yield potential
Benchmarking provides objective quantitative data that helps growers understand whether their lighting strategy is performing as expected and where improvements can be made.
Key Horticultural Lighting Metrics Every CEA Grower Should Track
1. Photosynthetic Photon Flux Density (PPFD)
PPFD measures the amount of photosynthetically active radiation (PAR) reaching a specific area of the crop canopy, expressed in μmol/m²/s.
PPFD is often the most important measurement for evaluating supplemental lighting performance because it directly reflects the light available for photosynthesis.
Questions to ask:
- Are measured PPFD values consistent with original lighting plan targets?
- Are there significant differences between growing zones?
- Has canopy growth altered light distribution?
2. Daily Light Integral (DLI)
While PPFD measures instantaneous light levels, DLI measures the cumulative amount of photosynthetically active light received over a 24-hour period.
DLI is often a more meaningful metric because plant growth depends on total light accumulation rather than momentary measurements.
Different crops have different DLI requirements:
- Lettuce: approximately 12–17 mol/m²/day
- Herbs: approximately 10 to 25 mol/m²/day, depending on species
- Tomatoes: approximately 20–30 mol/m²/day
- Cucumbers: approximately 20–30 mol/m²/day
- Ornamentals: highly crop-specific
Ranges from Virginia Cooperative Extension, Calculating and Using Daily Light Integral (DLI), SPES-720 (2025).
By comparing actual DLI measurements against crop targets, growers can determine whether supplemental lighting schedules require adjustment.
3. Uniformity
Light uniformity is frequently overlooked but has a direct impact on crop consistency.
A CEA facility may achieve its target average PPFD while still producing inconsistent crops if some areas receive significantly more or less light than others.
Indicators of poor lighting uniformity include:
- Uneven plant height
- Variable flowering times
- Inconsistent fruit development
- Differences in crop maturity across growing zones
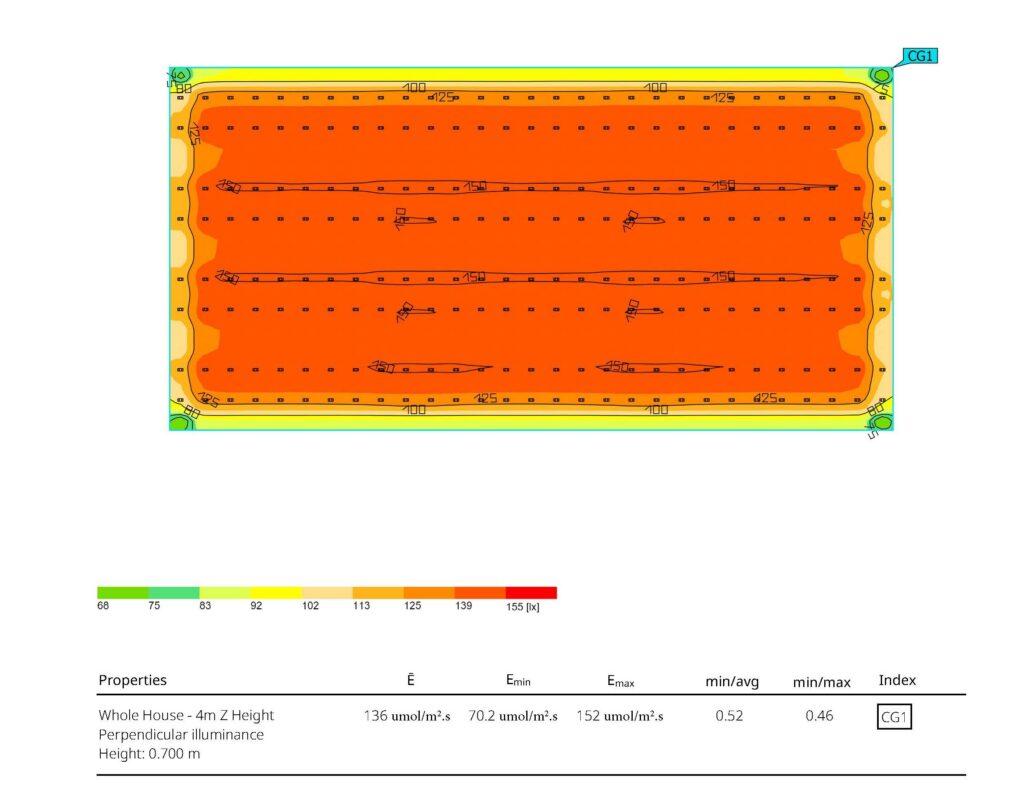
Mid-season mapping of PPFD measurements throughout the facility can reveal uniformity issues before they impact harvest quality.
4. Energy Efficiency
Benchmarking should evaluate not only light output but also how efficiently the system is producing that light.
Key metrics include:
- Fixture efficacy (μmol/J)
- Total energy consumption
- Energy cost per square foot
- Energy cost per kilogram of crop produced
Tracking these metrics allows growers to identify opportunities for operational savings while maintaining production targets.
How to Conduct a Mid-Season Lighting Assessment
Step 1: Review Original Lighting Plan Targets
Start by gathering:
- Lighting plan layout drawings
- Photometric plans
- Target PPFD values
- DLI objectives
- Energy consumption projections
These documents establish the baseline against which current performance can be measured.
Step 2: Measure Canopy-Level Light
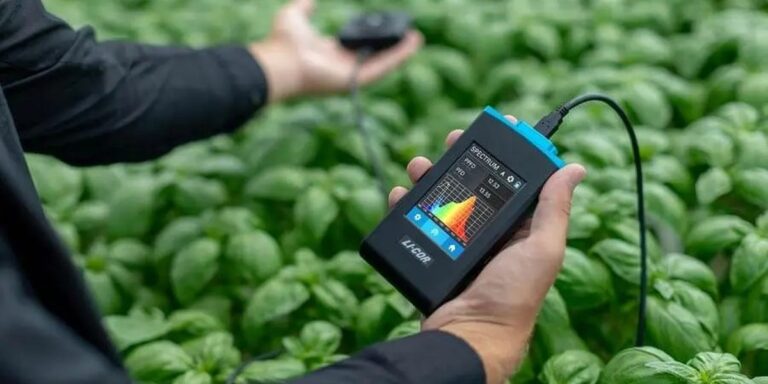
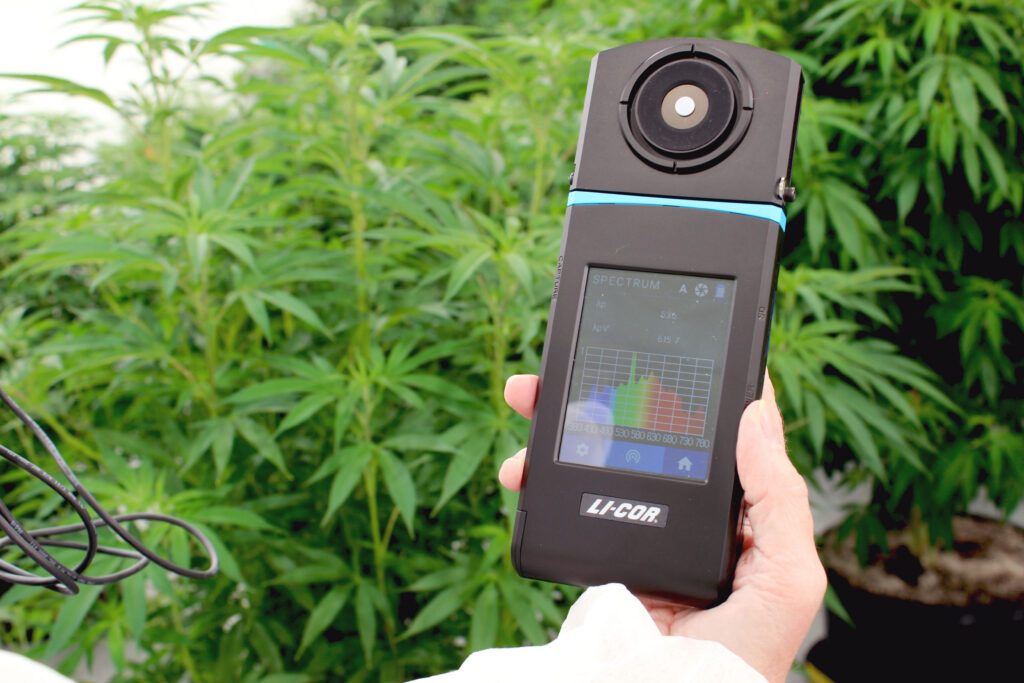
Use a calibrated quantum sensor or PAR meter to collect PPFD readings at multiple locations throughout the facility.
Measurements should be taken:
- At canopy level
- During normal operating conditions
- Across representative growing zones
- At a consistent time of day
Create a measurement grid to identify patterns and uncover localized performance issues. Read more about measuring your horticulture lighting performance in our detailed article.
Step 3: Evaluate Fixture Performance
Inspect horticultural lighting fixtures for:
- Dust accumulation
- Condensation issues
- Physical damage
- Lens discoloration
- Driver or ballast failures
- Electrical connection problems
Even minor contamination can reduce light transmission and negatively affect overall system performance, in turn reducing crop yield.
Step 4: Compare Energy Usage Against Expectations
Review utility bills and energy monitoring systems to compare actual energy consumption with original projections.
Consider:
- Seasonal utility rate changes
- Lighting schedule adjustments
- Environmental control interactions
- HVAC and dehumidification impacts
For hybrid lighting systems, evaluate whether the balance between LED and HPS operation remains optimized for current conditions.
Step 5: Analyze Crop Response
Horticultural lighting performance should always be evaluated alongside crop performance.
Look for correlations between measured light levels and:
- Growth rates
- Biomass accumulation
- Yield
- Flowering response
- Crop quality
- Harvest timing
The most valuable benchmarking programs combine environmental data with production outcomes.
Common Mid-Season Issues Growers Discover
Reduced Fixture Output
Over time, all horticultural lighting systems experience some level of performance degradation.
Potential causes include:
- Aging LEDs
- Ballast degradation
- Dirty optics
- Electrical issues
Routine benchmarking helps identify output losses before they significantly affect crop production. Learn how to maintain your horticulture lighting systems on our blog.
Dirty Greenhouse Surfaces
Greenhouse glazing and fixture surfaces naturally accumulate dust, algae, and residue.
Dirt and buildup on fixtures reduce the light that reaches the crop. Michigan State University’s Roberto Lopez estimates that dirty reflectors alone can cut light output by 8 to 15%.
Regular cleaning schedules should be incorporated into all CEA maintenance programs.
Canopy Shading
As crops mature, canopy architecture changes.
Dense canopies can:
- Increase self-shading
- Reduce lower-canopy light penetration
- Create microclimate differences
Benchmarking allows growers to determine whether pruning, spacing, or lighting adjustments may improve light distribution.
Control System Drift
Lighting control systems may be modified over time as production priorities evolve.
Benchmarking helps ensure that:
- Photoperiod settings remain correct
- Light thresholds are optimized
- Dimming strategies are functioning properly
- Integration with environmental controls remains effective
Creating a Seasonal Horticultural Lighting Benchmark Report
Leading CEA operations often create a simple benchmarking report containing:
Lighting Metrics
- Average PPFD
- DLI by zone
- Uniformity ratio
- Fixture operating status
Energy Metrics
- Monthly energy consumption
- Horticultural lighting energy cost
- Cost per square foot
- Cost per unit of production
Crop Metrics
- Yield
- Quality indicators
- Harvest timing
- Crop uniformity
Tracking these metrics year-over-year creates a powerful dataset for improving future supplemental lighting decisions and capital investment planning.
Turning Data Into Better Growing Decisions
The most successful growers view horticultural lighting as a dynamic production tool rather than a fixed infrastructure asset.
Mid-season benchmarking provides valuable insight into:
- Whether lighting goals are being achieved
- How efficiently the system is operating
- Where maintenance is required
- Which adjustments can improve crop outcomes
By combining light measurements, energy data, and crop performance metrics, CEA growers can make informed decisions that improve productivity, consistency, and profitability.
Partnering With Lighting Experts
As horticultural lighting technology continues to evolve, benchmarking becomes increasingly important for maximizing system performance.
Whether operating HPS, LED, or hybrid installations, CEA growers benefit from regular performance assessments that verify light delivery, optimize energy usage, and support crop-specific production goals.
At P.L. Light Systems, we work closely with growers to help evaluate their specific horticultural lighting performance, identify optimization opportunities, and ensure horticultural lighting systems continue delivering value throughout their operational life.
Ready to optimize your horticultural lighting strategy?
Request a Light Plan to see how our team can help benchmark your horticultural lighting performance and maximize the return on your CEA lighting investment.
Frequently Asked Questions
Why is it important to benchmark horticulture lighting performance?
Benchmarking provides objective quantitative data that helps growers understand whether their lighting strategy is performing as expected and where improvements can be made. It can help identify factors that impact overall PPFD like fixture failures, dirt accumulation, light deterioration, or wiring issues.
What are some metrics used to benchmark horticulture lighting performance?
An informative benchmark report starts with four key metrics that should be recorded every time lighting performance is measured. Those metrics are Photosynthetic Photon Flux Density (PPFD), Daily Light Integral (DLI), light uniformity, and energy efficiency.
What causes decreases in supplemental lighting performance?
Common issues that growers discover when performing regular lighting measurements include aging LEDs, burnt out HPS lamps, ballast degradation, dirty optics or reflectors, or electrical issues.
Tell us your crop, structure, and targets. We engineer the rest.